
The Summary Quick Read
In this blog entry I argue that the UK's net contribution to the EU budget (at around £7bn in 2015) is money well spent. EU administration takes just 6 per cent of this. The rest supports economic development and agriculture within the EU, international development outside it, and helps companies to be competitive and people to be productive and access employment.
True, much of this money is not spent in the UK and helps, amongst others, the least developed regions of the EU. This is both an act of solidarity and an articulation of British self-interest. It gives the UK decisive advantages as one of the big three EU players. These come in the form of clout and heft within the policy mechanisms of the EU and the expansion of the single market in goods and services.
Compared to the economic advantages the UK has exploited as a member of the EU (it has grown faster than other major EU economies) the Budget contribution (the lowest by percentage of Gross
National Income in the EU) looks like an amazingly good deal and an effective piece of public investment. Of course, there is room for improvement. There always is. But simply
counting the beans (or miscounting them as the Leave campaign has done on an industrial scale) rather than looking at what those beans have grown into is a very narrow way of looking at the
world, the EU and the UK's place at its heart.
As the one time Chief Executive of Cornwall Neighbourhoods for Change I have had more than a passing relationship with both managing EU regional and social cohesion funding and selecting and supporting projects to access that funding. During that time, and although accessing EU funding has its own learning curve to climb, it never seemed to me that the 'EU' or 'Commission' were deciding what the Cornwall Objective One programme - as it then was - was to be. It was a partnership that while complex and hierarchical also achieved many significant innovations and additions to Cornwall's economy.
Introduction
Although controversy rages about the amount of the UK's EU budget contribution this blog is less about the amount - although that is important too - than what actually happens to the public money that the UK feeds into the EU budget. Maybe I have just missed the articles and blogs but I have yet to come across a piece of writing that looks at these issues. Instead the fixation is on the number of beans rather than what is being done with them.
That has certainly grabbed the headlines and has been a potent campaigning tool for the Vote Leave campaign. But what is the EU budget actually for? What is it spent on? And what does the UK achieve by contributing to that spending?
To start at the beginning, this isn't an expert's view of the EU budget and the UK contribution. I've gone out and looked for answers to questions I've had. At times I've had to make some guesses or estimates but by and large the figures presented here can be pretty robustly defended by the facts.
The EU Budget
The EU has a budget that is roughly equivalent to one per cent of the national income of the single market of the combined 28 EU member states. In 2015 the EU budget was £141bn. The EU budget is decided by the Council of Ministers (it's formal title is The Council of Europe) comprised of ministers of the EU ember states and the European Parliament comprised of its elected members.
Figure 1 below shows the different spending areas and proportions that that the EU 2015 budget covered. This is divided between spending on Competitiveness for private sector companies (11%), Social cohesion and regional development (36%), Sustainable Growth largely through agriculture (40%), Security and Citizenship (2%), foreign aid for international development (5%) and the administration (6%) of the institutions of the EU - primarily the Council of Ministers, the Commission and the European Parliament .

The UK's EU Budget Contribution
Arriving at hard and fast figures for the UK's EU budget contribution is complicated by factors such as the £/€ exchange rate and the different timing of tax and financial years. And it is a controversial area.
Part of this contention lies in the fact that although the UK pays into the EU budget it also receives money back from the budget under its different spending heads - think for example of Common Agriculture payments made to UK farms. So there is a gross figure that goes to Brussels and a net figure that takes into account the so-called public sector receipts of funding back to the UK from Brussels.
This is further complicated by the fact that the EU budget also funds private sector projects through competitiveness initiatives and funding for research. These are the so-called private sector receipts of EU funding.
Keeping a track of and measuring these different funding streams as they cross between the UK and Brussels and back again is not always easy.
The UK Rebate
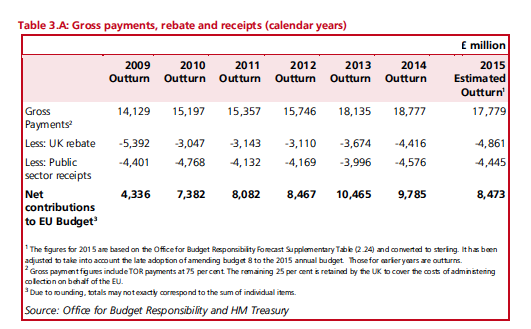
If this were not complex enough there is also the issue of the UK's EU budget rebate. Won by Margaret Thatcher and jealously guarded since this is an amount, well quite a big amount at £4.87bn in 2015, that is subtracted before the UK pays any money into the EU budget. So although the UK's nominal contribution in 2015 is listed as £17.8bn this was not the amount of money 'sent to Brussels'. It was actually £12.92bn (see Table 1 below).
But even the £12.9bn figure is potentially misleading because of those public and private sector receipts of money that flow from the EU budget to the UK via Regional Fund, Social Cohesion Fund and Common Agriculture Policy payments, amongst others. So when the the public sector receipts for 2015 are taken into account the UK contribution is further reduced from the gross-minus-rebate figure of £12.9bn to £8.47bn.
And, yet, there is more good news. But this is harder to quantify for 2015.
In the UK Treasury document that I have used here (European Union Finances 2015: Statement on the 2015 Budget and measures to counter fraud and financial mismanagement, December 2015) there is also mention that further EU payments come back to the UK via payments directly to the private sector. These do not appear in the public sector accounts but an estimate for these receipts in 2013 is given as £1.4bn. I have subtracted this figure from public-sector-receipts-net-contribution figure to arrive at an UK EU budget contribution - the public sector plus private sector receipts net contribution- for 2015 of £7.073bn.
Of course, it is contentious to use the private sector receipt figure from two years back to work out the 2015 UK net budget contribution. But needs must. And strangely enough it sums out at a UK net contribution that is very similar to the one tentatively backed by the ONS.
Because the Office of National Statistics has looked at the European Commission's own data for the UK's net contribution (there is not yet a figure for 2015) and averaged this for the period 2010-14. This smooths out some of the variations in the EU budget size and comes out at a UK net contribution figure of £7.1bn when all public sector and private sector receipts are taken into account.
The ONS states that this way of looking at UK contributions 'is arguably a more complete picture of the money that flows between the UK and the EU.'
On that basis I have decided to use the sum of £7.07bn to represent a good enough estimate of the UK's net contribution (minus rebate and public and private sector receipts) to the EU budget in 2015, particularly as the 2015 net contribution (minus rebate and public receipts - see Table 1 below) - is smaller than the contributions in 2013 and 2014.
It is complicated. But it is not really that complicated.
I have put these different ways of arriving at a good estimate of the net contribution figure in Table 2 below. Column B is the gross contribution minus rebate. Column C is the net contribution that excludes the rebate and private receipts. And Column D is the net contribution that excludes the rebate and public and private sector receipts.
The Leave campaign's figure of £350m a week is simply wrong
One thing that immediately leaps out of Table 2 below (see the Weekly Payments row) is the range of numbers we can get for the supposed weekly contribution of the UK to the EU budget. The Leave campaign claims this is £350m. This is wrong, as many have pointed out, as it fails to take into account the whopping rebate of £4.9bn which never even makes it to Brussels let alone the public and private sector money that comes back to the UK through different EU budget heads.
If we use the gross contriubtion figure minus the rebate we get weekly payments of £248m (Column B). Using the much more realistic figure of the UK net contribution (rebate and public sector receipts subtracted) we arrive at weekly payments of £163m (Column C). And when we net off the rebate plus public sector and private sector receipts we get a still further reduced weekly payment of £136m (Column D).
These are still large amounts of money but the net contribution weekly payment of £136m (Column D in Table 2 below) is much less than half the £350m claimed as a fact by the Leave campaign. That the public is being asked to vote in probably the most momentous electoral decision for a generation on such a false, and yet widely believed (47% of the UK public), prospectus is shocking.
I know they say that we get the politics and politicians we deserve. But surely we did not deserve this.

Where does the money go?
In order to try and understand where the UK's contribution to the EU budget goes I have taken the overall proportional allocations of the EU 2015 budget of £141.2bn and applied these to the UK contribution. This is not as straightforward as it might seem because when we are dealing with a net contribution some budget head allocations stay constant and some change. (The note under Table 2 explains this.)
The EU budget allocation column (A) shows overall where the EU budget is spent. This is divided between spending on Competitiveness for private sector companies (11%), Social cohesion and regional development (36%), Sustainable Growth largely through agriculture (40%). These budget heads fund programmes that lead some EU budget funds back into the UK.
There are smaller budget heads for Security and Citizenship (2%), foreign aid for international development (5%) and the administration of the institutions of the EU (6%). I have assumed that none of this money comes back to the UK.
Administering the EU
Table B above shows that the UK contribution in 2015 to the administration of the EU and its staff of 55,000 civil servants was in the region of £775m. (That is 6 per cent of the UK's gross-minus-rebate contribution.)
For comparison, the cost of running UK government departments in 2013-14 was £11.7bn and the much reduced civil civil service headcount in 2014 was about 410,000.
So the UK's contribution to the EU budget, the so-called 'gravy train', is equal to 7 per cent of the cost of running the UK's central government departments. Or to put it another way it costs 15 times as much to run UK government departments as it does to run the institutions of the EU.
That's not really surprising. The UK government departments deliver programmes on the ground - think of state pensions, benefits assessment and payments, collecting taxes etc. - while the institutions of the EU do not.
And the rest of the money?
If 6% of the UK's EU gross-minus-rebate budget contribution goes to the administration of the EU where did the rest go?
Once funds (public and private sector receipts) coming back to the UK have been stripped out the UK contribution the biggest amount, (my estimated allocation) is the £2.5bn, (Column D in Table 2) that went to the budget head of 'Sustainable Growth'. This is largely accounted for by payments to EU farmers.
But note this sum does not include CAP payments to UK farmers because we are dealing with the net contribution figure (that is, minus rebate which stays in the UK and public and private sector receipts that flow back to the UK - which includes CAP payments to UK farms). So this figure of £2.5bn is a transfer to non-UK agriculture.
You might well ask: why is the UK giving money to EU farms that are not in UK - it works out at roughly £38 per year per head of the UK population of 65m. I reckon that's 73p per person a week.
The second biggest part of the UK's net EU budget contribution goes to Economic Cohesion - this concerns both funds to regions that have less than 75% of the EU's average GDP and funds that go to assisting with the development of employment and access to employment opportunities. My calculations suggests this amount was around £2.2bn in 2014 (Column D in Table 2).
As with the CAP figure above this is a net contribution because the cohesion funds that come back to the UK have been stripped out of Column C and D in Table 2. So in effect the UK is transferring £2.2bn to the other parts of the EU.
The same can be said with regard to the Competitiveness heading at £0.68bn.
The last two budget heads concern Security and Citizenship (£0.26bn) and Global Europe (£0.65bn). Global Europe is comprised of foreign aid donations to other countries both as help to EU neighbouring countries and as international development aid. I have argued that none of these funds come back to the UK although of course there may be exceptions.
So where are we up to?
So far I have argued that the net UK contribution (minus rebate and public and private sector receipts) to the EU budget in 2015 was in the region of £7.1bn. And I've said that a small proportion (6 per cent) of the gross-minus-rebate contribution helped pay for the administration cost of the EU - the Council, Commission, Parliament and other institutions.
The bulk (80%) of the the UK's net EU budget contribution was in effect a transfer payment to other parts of the EU of something like £5.4bn (Table 2, Column D - sum of Competitiveness, Economic Cohesion and Global Growth) via the mechanisms of the CAP, Regional and Cohesion funds and Competitiveness initiatives.
Maybe it is not surprising that these figures have not featured in the UK's referendum campaign - although you would have thought that the Leave campaigns would have exploited them mercilessly. Instead they have concentrated on the erroneous headline figure of a UK weekly contribution into the EU budget of £350m. Which they have of course exploited mercilessly.
Amazingly, despite being challenged and shown to be wrong, 47% of the UK public still believe this figure. By not giving the public details of the budget they are denied the material (he said super naively) to think these issues through.* See Footnote

Is it a giveaway?
Such is the fever pitch of anger at the moment that we mightwell ask: what the hell is the UK doing 'giving away' £5.4bn annually to other parts of the bloody EU?
Don't we have enough unmet domestic spending needs to use our money for our welfare? And, of course, that is a perfectly valid question and one I've asked myself as a non-expert in these matters.
But before we go any further let's just check out what that £5.4bn means, put it in some context, because it sounds a chuff of a lot of money.
The total amount of economic wealth created in the UK - the gross domestic product - in 2014 was £1,582bn. So the bit that the UK 'gave away' to other parts of the EU was equivalent to 0.34% - give or take - of the UK economy's total wealth.
In terms of UK public spending (2014 £734.6bn) the percentage is a bit higher at about 0.73 per cent.
Is that a lot or a little?
Well, £5.4bn is a lot of money. No doubt about it.
But we are not talking here about individual wealth or lottery wins. Put in the context of UK GDP it is about one three-hundredth of the total wealth created by the economy or slightly less than one per cent of total UK public spending.
Still, in a time of austerity (or not, for that matter) you'd want to know what that money was doing and what it was buying. Or at least know that someone - a public, elected politician for example - knew what that money was buying and for why. It would be interesting to ask a few MP and MEPS about this.
On the face of it that £5.4bn looks like a giveaway, a straight transfer to other people in other parts of the EU who are not part of the UK. Why would you do that? Why, in fact, is the UK a net contributor to the EU?
The answer to those questions lies in three words. The first is solidarity and the second are self interest.

Solidarity for ever?
Since the emergence of social democratic politics and parties in the early 20th century - like the UK's Labour Party amongst many others - and the foundation of the welfare state there has been an avowed aim to lessen and combat the demeaning and life-shortening effects of inequality, poverty and misfortune. So modern welfare states are designed, amongst other things, to assist the poorest and most vulnerable members of society through welfare payments to individuals - whether this be for the unemployed, the sick, those with disabilities, the elderly, the poorly paid etc - and through programmes such as regional development and industrial adjustment projects to help particular geographical (think Port Talbot) or sectoral parts (think steel) of the economy and labour market.
Welfare payments are a moral good - they recognise that life chances are not equal and that through no fault of their own people fall on or are born into hard times through intergenerational poverty, social class, unemployment, sickness, accident, divorce, caring necessities etc.
But normally general transfers of welfare spending take place within a single welfare state rather than between states. Welfare payments in the UK in 2014/5 equalled £258bn. These payments to individuals were made through state pensions and a range of individual and family benefits.

The EU budget is not a welfare budget
The £5.4bn net contribution (Column D Table 2 Competitiveness, Cohesion and Growth summed) the UK made to the EU 2015 budget for agriculture, regional development, social cohesion and competitiveness outside of the UK was not a welfare transfer to individuals.
In the case of agriculture it went to agricultural enterprises (farms and smallholdings) and rural development and environmental projects outside the UK in pursuit of the aims of the slowly changing Common Agricultural Policy. In the case of Regional Funds it went to economic development projects in the so-called 'lagging' regions of the EU outside the UK (those with less than 75% of the average EU GDP).
This latter investment can be for infrastructure projects such as transport links or to help develop job creating initiativies and enterprises. Social cohesion funds tend to go to creating projects that assist individuals access work or gain the skills to be employable. Competitiveness funds go to companies and business support organisations working to increase private sector activity.
But why, you might ask, is the UK spending £.5.4bn to allow the EU to do this in the rest of the EU? What is the point?
Well, from a social democratic viewpoint of solidarity the point is that the EU of 28 member states is made up of :
- member states who have very different levels of national wealth (think for example of Germany against Bulgaria) and
- member states who have very different levels of regional wealth within the nation (think, for example Madrid versus Andalusia).
Regional and social cohesion funds aim to reduce - however marginally - those differences in the entirely laudable pursuit of an inclusive, diverse and expanding European economy and society.
Chart 4 below shows this disparity of wealth between the EU 28 member states against the average GDP per head of the EU 28 (average = 100).
Tiny Luxembourg has a GDP per head nearly two and three quarters bigger than the EU 28 average. Whereas Bulgaria has a GDP per head that is less than half the EU average. The UK is above the average but not by a great deal.

Map A below shows the disparity of regional wealth in the EU 28 member states. Note that two UK regions and one country have less than 75% of the average EU GDP - Cornwall and the North East of England and Wales. As can quickly be seen from this map the majority of the poorest regions in the EU are in the south - southern Spain and southern Italy and Greece - and in the east and south east - Eastern Europe and the Baltic and Balkan states.
(NB Iceland, Switzerland and Norway are not part of the EU but they pay into its budget nonetheless.)

So EU regional and social cohesion funds are there to help the less fortunate regions of the EU 'catch up' with the rest. Although some would argue that the sums of money devoted to this task although substantial are insufficient to make a major impact on reducing levels of member state and regional wealth disparity. But that is what they are there for and along with the Competitiveness initiative that is what the UK contribution to the EU budget of £5.4bn in 2015 was contributing towards.
It's not so much a 'hand out' as a 'help up' transfer and it does not go to individuals but via programmes and projects to public, private and Third sector (NGOS, charitable organisations etc) enterprises.
I have, for my sins, been involved in both the spending and the administration of these funds and I think it would be safe to say that overall there is a robust accounting and accountability mechanism for accessing and using these them. As the ex-Chief Executive of Cornwall Neighbourhoods for Change I have personally been on the sharp end of a Level 3 EU Audit and, take it from me, it is not a pleasant experience if you are found wanting. (We were not.)
And the self interest?
But is this all done in the name of solidarity alone, you ask?
Well, as with much solidarity there is also a good degree of self-interest in it. Altruism, as they say, has a short shelf life.
So what is the return to the UK on the UK's contribution to the EU budget?
For a start, it buys the UK influence in the EU as one of the biggest member states and one of the biggest net contributors. As such the budget contribution helps to give the UK a powerful voice in the shaping of the EU's policies and regulations. Along with Germany and France, the UK is one of the three big beasts of the EU and not much happens without the approval of the UK at the Council of Ministers and within the Commission (see this very useful video by Professor Michael Dougan). This isn't the way much of the media presents the UK in the EU but that nest of vipers is for another day.
Note that the UK is such a clever player in the EU that it actually pays a smaller percentage of its Gross National Income to the EU than any other EU member state (see Chart 2 above). That is a fact that suggests to me that the UK is very good at looking after its interests within the Council of Europe, the European Commission and the European Parliament.
Secondly, the expansion of the EU has been a key strategic UK interest both in terms of increasing the size of the single market and opening it up to UK businesses, workers, students, tourists and consumers and in creating a stronger European political alliance in an ever changing world. The bigger the market the bigger the stick the EU can carry in global trade negotiations. This allows the EU to drive standard setting at a global level which in turn can reduce transaction costs for UK businesses exporting beyond the EU.
And thirdly, as with all funds for economic development, there is an expectation that the developing economic prosperity of other regions and countries of the EU will be to the benefit of the UK through the growth of the trade in goods and services in the single market.

So. The UK EU Budget contribution? Is it money well spent?
To put it slightly differently, is the UK's contribution to the EU a waste of money and an unnecessary diversion of money away from UK needs?
No. Membership of the EU and the creation and expansion of the single market has been hugely beneficial to the UK. Yes, it is true that if we left the EU tomorrow we would have an extra £7bn to spend each year (unless we went crawling back to try and join the European Economic Area or do some complicated bi-lateral deal à la Suisse).
But it is very likely that by withdrawing ourselves from access to the single market the UK economy would suffer in the short and longer-term and the gain in not paying into the EU would be quickly wiped out by losses of tax revenue due to lower economic growth.
And after all, isn't it good to be part of, and a major player in, the the EU project? And isn't it good to give a hand up to those regions and countries that are so much less wealthy than the UK? That have shaken off dictatorship and that have joined in the shared values of the EU? Isn't that what solidarity is about? And doesn't it also serve our economic and strategic national interests at the same time?
To me it's a no-brainer. Sure, there are improvements to be made in terms of the CAP and fraud and accountability. There always are. But positive changes have been made and will continue to be made. The EU - if you can say this - is not 'thick'. And the UK has a large and well-organised voice within it. And the world is a rapidly changing place. I think we are stronger and better together and that as a country we have enough clout and heft within the EU to quite happily look after our own interests, diverse and contradictory though at times these may be.
With all these things, if you only count the bean seeds rather than looking at what the beans have grown into it is a very narrow way of looking at the world, the EU and the UK's place at its heart.
Footnote
The same goes for the Vote Leave claim that the total UK contribution to the EU since membership began in 1973 is £503.3bn. This does not take account of the UK's rebate nor EU public sector receipts in the UK. Using a similar methodology to that used by the Vote Leave claim, Professor Ian Begg, at the London School of Economics has calculated that the gross contribution to the EU since membership is more like £400bn. But this is a gross figure and takes no account of the EU budget funds that come back to the UK through the Common Agricultural Policy and Regional and Social Cohesion funds, amongst others, since the UK joined up in 1973. If we use the proportion of the UK's EU net (Column D in Table 2 above) to gross- minus-rebate proportion (Column B) in the UK 2015 EU budget contribution (55%) as a very rough and ready guide this would potentially reduce this 'lifetime contribution' to the EU from £400bn to just shy of £216bn - almost half the Vote Leave claim.
Here my blog on why I'll be voting Remain.
Write a comment